Digital Medicine & Big Data.
We are harnessing the computational power of machine learning and artificial intelligence to enhance our understanding of molecules, materials and processes.
Not only can computer simulations verify laboratory observations, but they also prove useful in predicting experimental outcomes, and provide complimentary data to experiments.
We work with collaborators to use computer modelling to help screen molecules and systems far faster than is possible by physical experiments, and train computers to help us interpret experimental data.
Scroll down to read more.
We use computers to model the behaviour of real-life molecules.
Molecular dynamics is a powerful tool commonly used to study the behaviour of molecules.
We frequently work with collaborators to use molecular dynamics simulations in conjunction with laboratory experiments to study biochemical phenomena at the molecular scale. Not only can computer simulations verify laboratory observations, but they also prove useful in predicting experimental outcomes, and provide complimentary data to experiments.
For example, computer simulations have complemented our laboratory research of the interaction of peptides and proteins with nanomaterials, molecular self-assembly and the workings of biomarkers. Click here to read an example in Nature Communications.
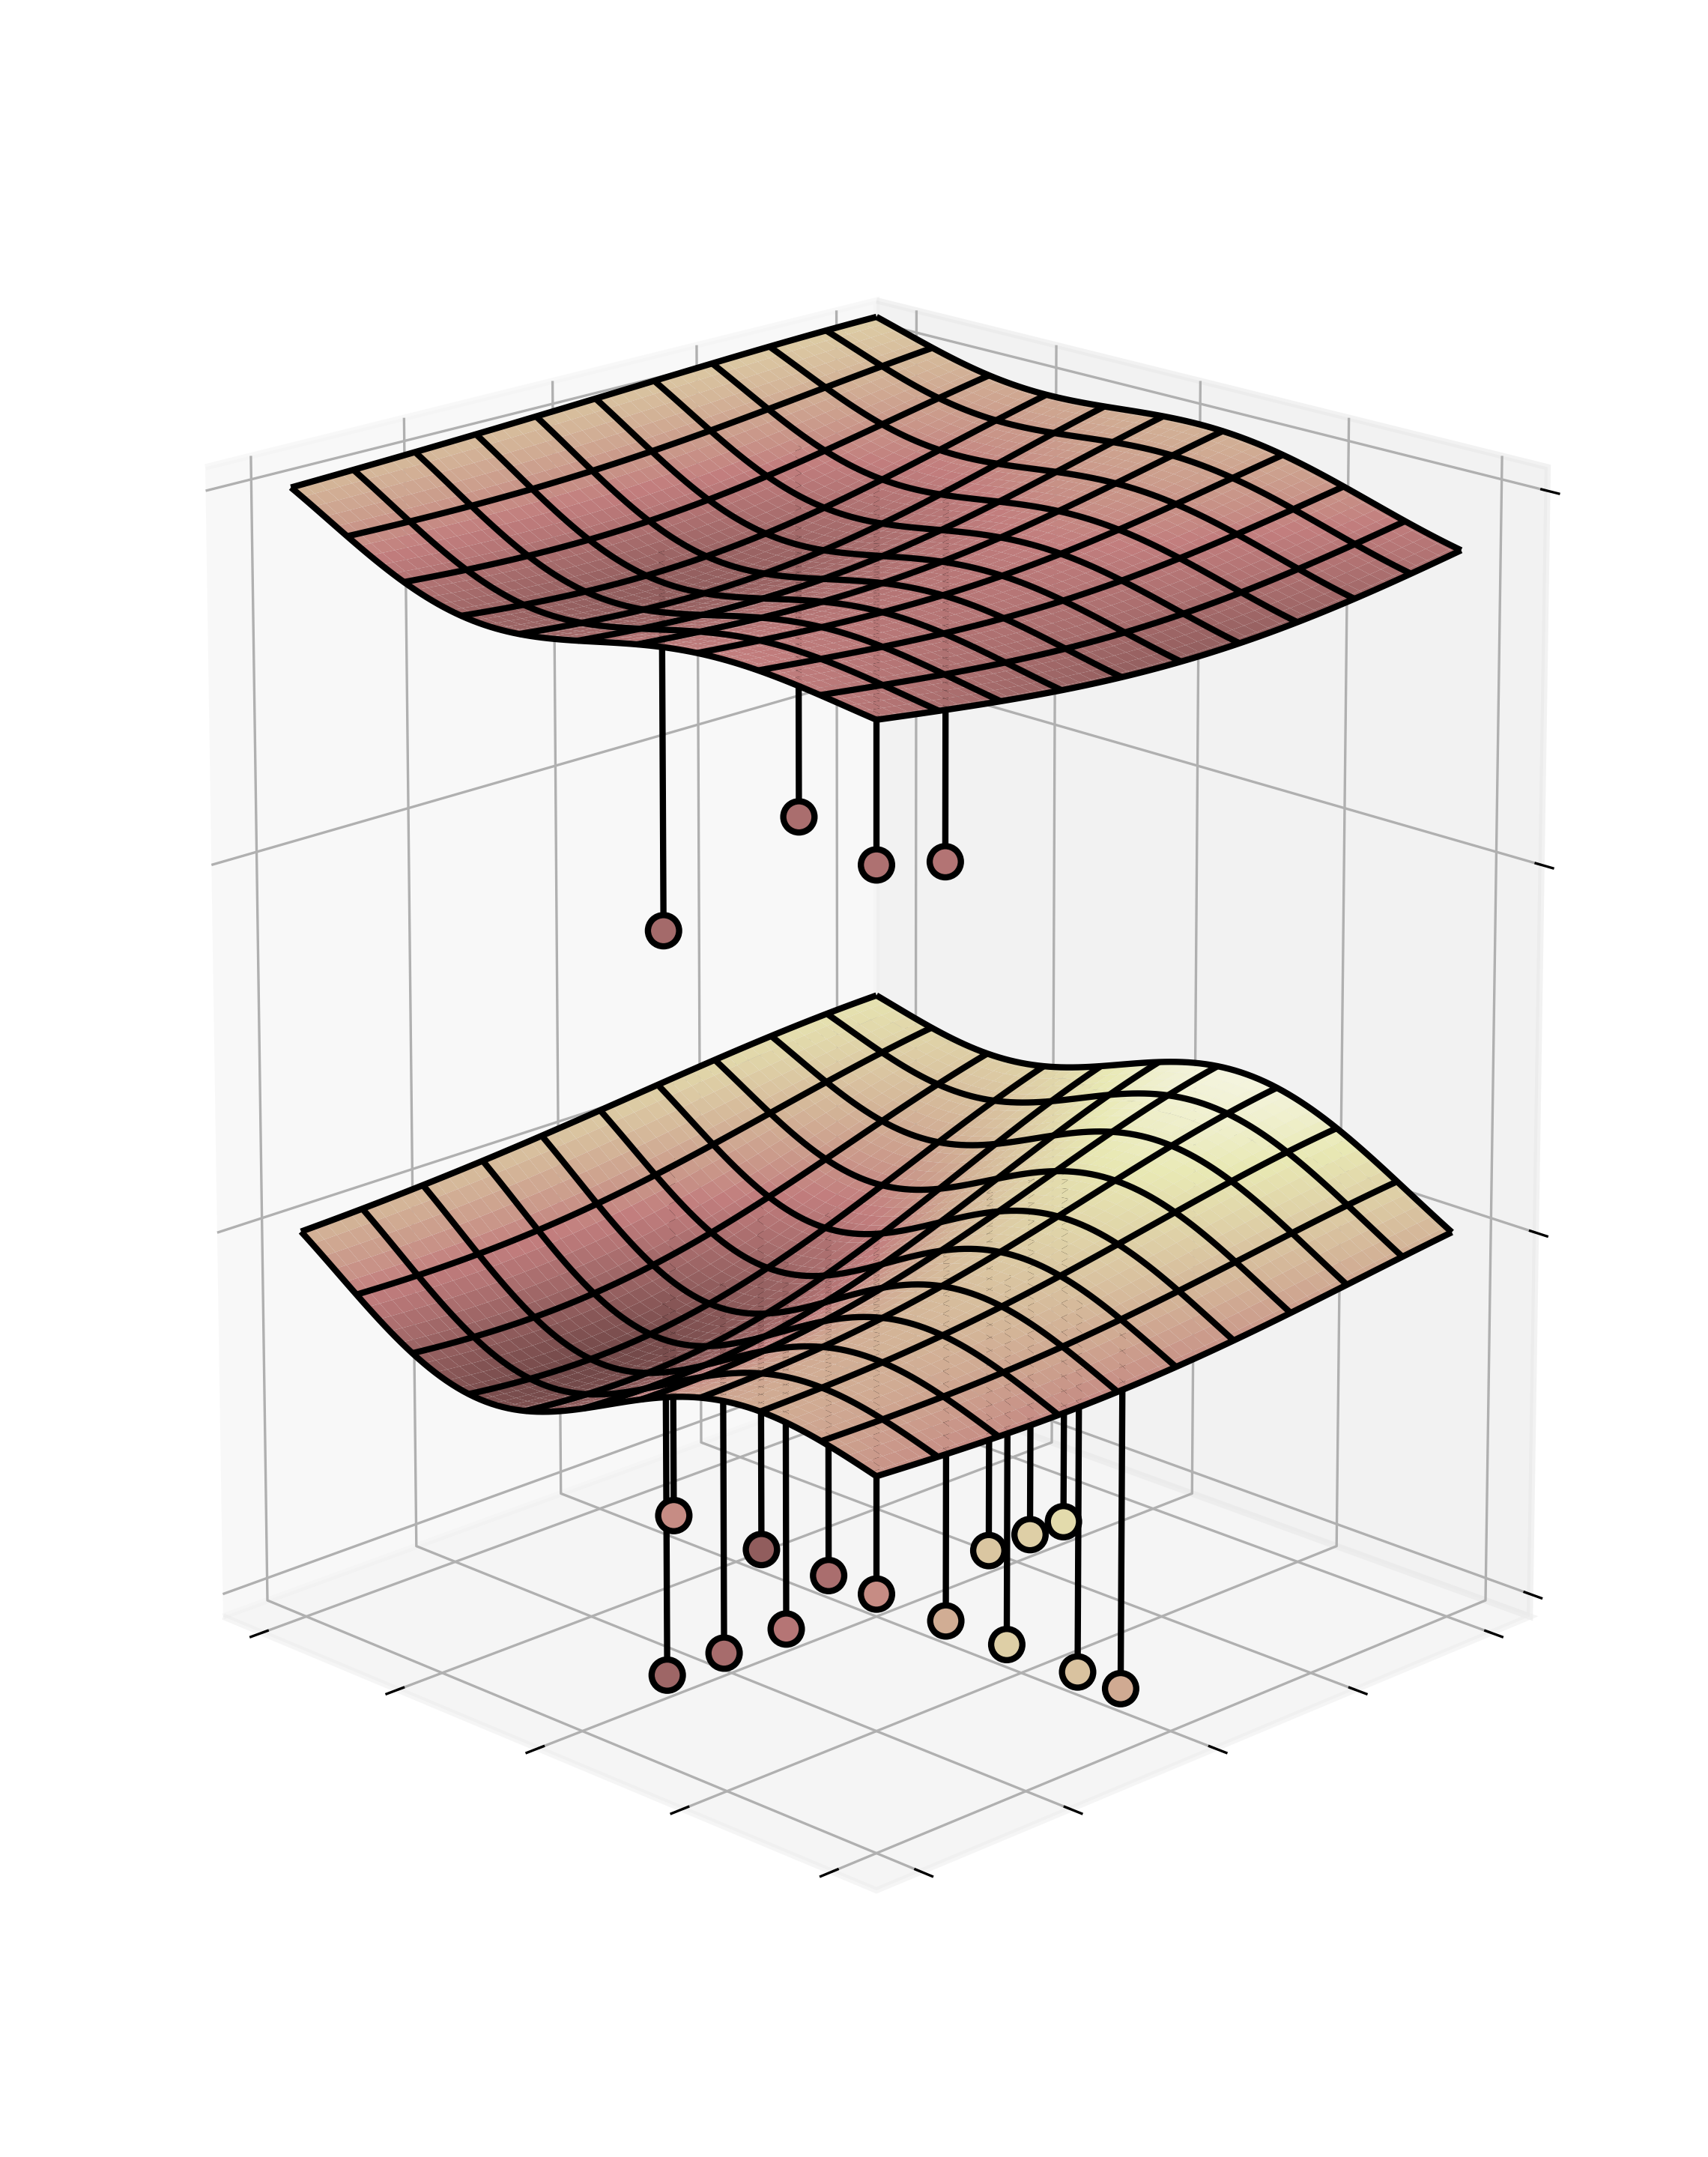
The image on the right is an illustration of how we use machine learning to rapidly tailor our diagnostic devices to new biological targets. In other words, computers help us learn from previous experiments and apply those findings to the next.
Click here to read an example of this work in Nano Letters.
Image credit: John Goertz
We use statistical modelling and machine learning to train computers to interpret experimental data.
Raman spectroscopy is a technique which uses laser light to decode precision information about materials; the elements and molecules present and how they are bonded. The instrument can scan across a surface and build up an accurate two-dimensional picture of the molecules present.
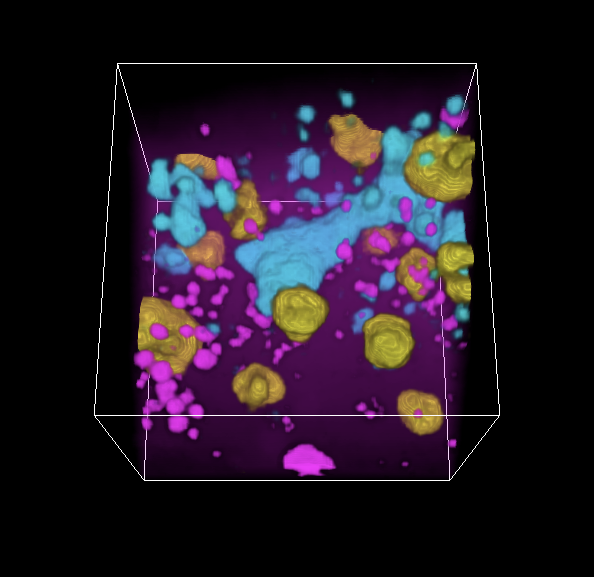
It is generally considered a surface technique, capable of providing a 2D representation of the chemical make-up of a flat sample. However, our software models are capable of interpreting the data to build a 3D chemical picture.
We employ and train a variety of statistical models to interpret the signals and build three-dimensional chemical maps which reveal the structural organisation of different molecules in various specimens of interest. From single-cells, to bioengineered tissues, to organs-on-chip, Raman chemical imaging allows high-resolution visualisation of biological phenomena historically unobservable by more traditional techniques, such as fluorescence microscopy.
Image credit: Vernon Lalone
We connect data from infectious disease diagnostic tests with smartphone technology.
Smartphone devices are becoming more widespread and increasingly integral to modern life in both developed and developing countries. This ubiquity brings great potential for health services to gather data about infectious diseases at a population level. Being able to track, trace and treat the spread of an infectious disease is critical to bringing outbreaks under control. This field is called mHealth.
Together with the i-sense research centre, we have analysed the potential for impact of smartphone-based health systems on low-income countries, where health clinics in rural areas can be scarce. Click here to read the paper in Nature.

One example is a paper-based diagnostic test for Ebola which reveals the presence of related antibodies in a person’s urine. These cheap and accurate tests can be interpreted by our app using the camera on a person’s smartphone. The app interprets the results of the test and registers the patient’s geo-location from the device, allowing us to capture and record information across wide geographical areas. These data can be used during and after epidemics of infectious diseases to effectively track, trace and treat an outbreak.
Selected Publications.
N. Kim, M. R. Thomas, M. S. Bergholt, I. J. Pence, H. Seong, P. Charchar, N. Todorova, A. Nagelkerke, A. Belessiotis-Richards, D. J. Payne, A. Gelmi, I. Yarovsky and M. M. Stevens
“Surface enhanced Raman scattering artificial nose for high dimensionality fingerprinting”
Nature Communications. 2020. 11: 207.
A. Belessiotis-Richards, S. G. Higgins, B. Butterworth, M. M. Stevens and A Alexander-Katz
“Single-Nanometer Changes in Nanopore Geometry Influence Curvature, Local Properties, and Protein Localization in Membrane Simulations”
Nano Lett. 2019. 19 (7): 4770.
Y. Lin, M. Penna, M. R. Thomas, J. P. Wojciechowski, V. Leonardo, Y. Wang, E. T. Pashuck, I. Yarovsky, M. M. Stevens
“Residue-Specific Solvation-Directed Thermodynamic and Kinetic Control over Peptide Self-Assembly with 1D/2D Structure Selection”
ACS Nano. 2019. 13(2): 1900.
M. N. Holme, M. H. Rashid, M. R. Thomas, H. M. G. Barriga, K.−L. Herpoldt, R. K. Heenan, C. A. Dreiss, J. L. Bañuelos, H. Xie, I. Yarovsky, M. M. Stevens
“Fate of Liposomes in the Presence of Phospholipase C and D: From Atomic to Supramolecular Lipid Arrangement”
ACS Central Science. 2018. 4(8): 1023.
Y. Lin, P. Charchar, A. J. Christofferson, M. R. Thomas, N. Todorova, M. M. Mazo, Q. Chen, J. Doutch, R. Richardson, I. Yarovsky, M. M. Stevens
“Surface Dynamics and Ligand–Core Interactions of Quantum Sized Photoluminescent Gold Nanoclusters”
J. Am. Chem. Soc. 2018. 140(51): 18217.
N. Amdursky, M. H. Rashid, M. M. Stevens and I. Yarovsky
“Exploring the binding sites and proton diffusion on insulin amyloid fibril surfaces by naphthol-based photoacid fluorescence and molecular simulations”
Scientific Reports. 2017. 7: 6245.